Most learning dashboards report activity such as completions, logins and hours, which describes what happened rather than what changed. Useful training analytics answer specific questions: who is out of compliance today, which cohorts differ, and what to show an auditor. MyPass LMS lets you filter and export on any parameter rather than accepting fixed dashboards.
The dashboard problem
There is a recognised pattern in learning analytics: the dashboard looks healthy while nobody can explain whether learning is helping the business. Completion rates are up, feedback scores are fine, and the question executives actually asked remains unanswered.
This is not a shortage of data. Learning platforms generate plenty. It is that most default dashboards are built to display activity metrics, and activity metrics do not answer the questions that get asked in real life:
- Is anyone out of compliance right now, and who exactly?
- Did the trained group perform differently from the untrained one?
- Can you produce evidence for this specific person, course and date?
- Which teams are falling behind, and which manager needs to know?
None of those are served by a completions-over-time chart. They need filtering on arbitrary parameters, which is a different capability from displaying a fixed dashboard.
What dynamic reporting means in practice
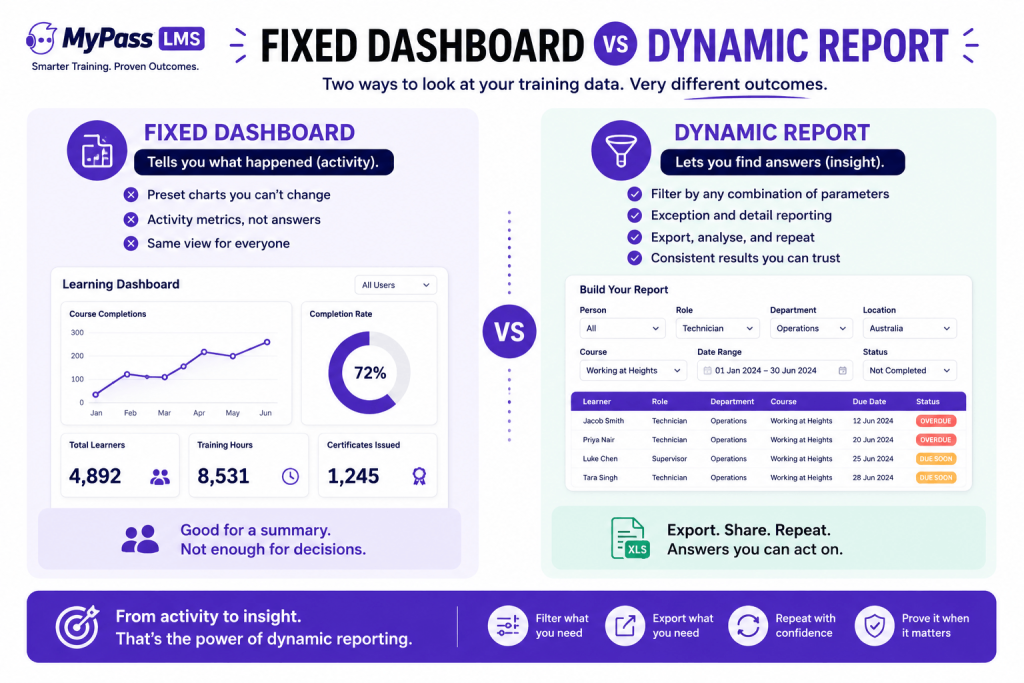
Dynamic reporting means you construct the query rather than choosing from preset views:
- Filter by any combination of person, role, department, location, course, learning path, date range and completion status.
- Report on exceptions rather than totals, which is usually what you actually need. Not 82 percent complete, but the 18 percent who are not and who their managers are.
- Export the result so it can be joined to business data in a spreadsheet or BI tool, which is the step that makes ROI analysis possible at all.
- Re-run the same query later and get a consistent answer, because the underlying records do not change retroactively.
The four reports that actually earn their place
- The compliance exception report. Everyone currently overdue or expiring within a defined window, grouped by manager. This is the report that prevents problems rather than describing them, and it should be scheduled rather than requested.
- The audit evidence report. One person, one course, one date, produced in under a minute. Audit-ready records are the whole point of compliance tracking, and the test is speed under pressure.
- The cohort comparison. Trained versus untrained, or before versus after, exported for joining to a business metric. This is the report that lets you answer the impact question rather than the activity one.
- The assessment gap report. Which questions or topics people fail most often, which tells you where the content or the underlying process is weak. This is the most under-used report in most organizations and the one that improves training rather than just documenting it.
| A practical rule: if a report does not change a decision or produce evidence, stop running it. Most learning dashboards contain several charts nobody has acted on in a year. |
Assessment analytics: the feedback loop most teams skip
Completion data tells you people finished. Assessment data tells you what they did not understand, and that is far more actionable.
Looking at performance across a cohort rather than per individual surfaces things worth knowing: a question everyone fails is usually a badly written question or a genuinely confusing policy; a topic that consistently scores low points at a content gap or a process that does not work the way the training describes; and a question everyone answers correctly is not testing anything.
Used this way, assessment analytics improve the training and occasionally the underlying operation. That is a considerably better use of the data than reporting an average score to a committee.
Reporting on in-person and online training together
A common blind spot: many organizations have decent reporting on online modules and nothing usable for in-person training, which sits on paper sign-in sheets. The result is a report that covers part of the programme while implying it covers all of it.
Because MyPass LMS captures in-person attendance digitally alongside online completions, and both feed the same records, a single report can cover the whole programme. For organizations whose most safety-critical training happens in a room rather than at a screen, that is the difference between reporting and evidence.
The bottom line
Most learning dashboards answer questions nobody asked. Useful training analytics are dynamic: filter on any parameter, report on exceptions rather than totals, export so the data can meet business data, and produce evidence for a specific person, course and date on demand. Build four reports rather than twenty, cover in-person training alongside online, and use assessment analytics to improve the training rather than merely to describe it.
See the platform features, read about audit-ready reporting, or start a 15-day free trial.
Frequently asked questions
What should an LMS report on?
Beyond completions: who is currently out of compliance and their managers, evidence for a specific person, course and date, cohort comparisons for trained versus untrained groups, and assessment performance across cohorts to identify content or process gaps.
What is dynamic reporting in an LMS?
The ability to construct reports by filtering on any combination of parameters such as person, role, department, location, course, date range and status, rather than choosing from fixed preset dashboards, with results exportable for further analysis.
Why are completion rates not enough?
Because they measure activity rather than impact. A completion report shows training happened, not that anything changed. Leadership increasingly asks whether training improved performance, which requires cohort comparison against a business metric rather than a completions chart.
What is an assessment gap report?
A view of which questions or topics learners fail most often across a cohort. It identifies badly written questions, genuine content gaps, or processes that do not work the way training describes, making it one of the few reports that improves training rather than only documenting it.
Can one report cover both online and in-person training?
It can when the platform captures in-person attendance digitally rather than on paper. In MyPass LMS, QR code attendance feeds the same records as online completions, so a single report covers the whole programme rather than only its online portion.